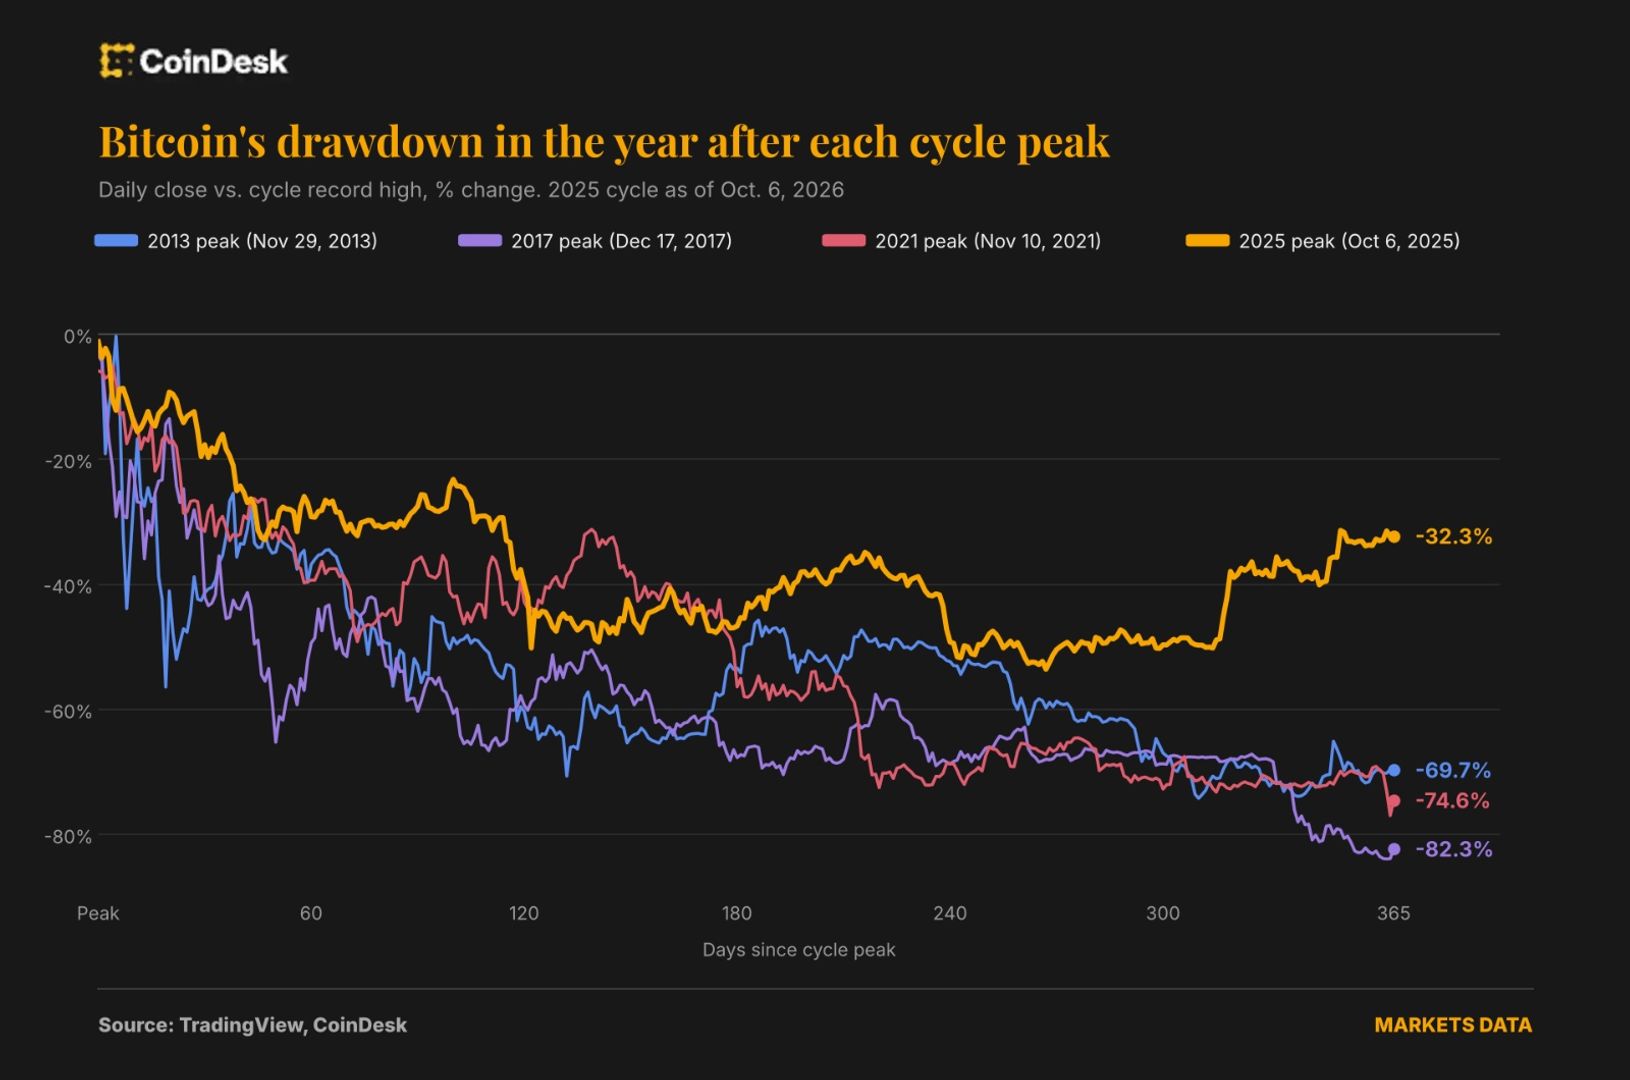
Bitcoin has fallen 32% from its record high of more than $126,000 reached on Oct. 6, 2025, standing at $85,453 one year later. According to CoinDesk, that decline is considerably smaller than the losses recorded one year after earlier cycle peaks, reflecting a market increasingly shaped by institutional investment, exchange-traded funds and lower leverage.
For bitcoin, a 32% decline would traditionally have been considered severe. Yet previous bear markets were substantially deeper. One year after the 2013 peak, bitcoin was down 69.7%. The cryptocurrency had lost 82.3% from its December 2017 top after a year, while the decline one year after the November 2021 high stood at 74.6%, based on CoinDesk calculations.
The latest downturn has also been less severe at its low point. Bitcoin fell to just below $59,000 on June 30, representing a decline of more than 53% from the record. Earlier bear markets produced drawdowns of between 77% and 85% from their highs.
The timing of the low has changed as well. In earlier cycles, bitcoin’s trough often arrived around the one-year anniversary of the peak or later. This time, the low came after roughly nine months, followed by a relatively rapid recovery. Tim Sun, a senior researcher at HashKey Group, described the shorter decline and the reduced time spent near the bottom as the most significant changes in the current cycle.
Institutional money has changed the cycle
The composition of bitcoin demand during the latest rally was different from that of previous cycles. Earlier advances were driven largely by retail traders and leveraged positions. When those rallies reversed, forced liquidations, fund failures and exchange problems could intensify the decline, as seen during the 2022 market crisis.
The 2023–25 uptrend instead attracted institutional capital through regulated investment products, including exchange-traded funds. Asset managers, family offices and corporations also became more involved, according to Sun. The subsequent decline was linked largely to capital outflows caused by changes in the broader macroeconomic environment and asset-allocation decisions, rather than a single unexpected shock.
Sun said this meant the market did not develop the persistent negative feedback loops that had marked earlier downturns. Griffin Ardern, co-founder and volatility-desk portfolio manager at Primal Fund, said ETF allocation money is typically rebalanced toward target weights, creating a mechanism that can buy during weakness rather than simply exit in a rush.
Leverage was also reduced sharply. Ardern said most of it was removed near the top and did not return in the same way. A macro-driven sell-off on Oct. 10 last year triggered more than $19 billion in liquidations across crypto derivatives markets. Temporary pricing differences on Binance involving tokens including USDe, wBETH and BNSOL added to the stress, while automatic deleveraging systems on several exchanges forcibly closed profitable positions to cover losses.
Lower volatility brings smaller declines—and smaller peaks
The more orderly correction may be part of a broader change in bitcoin’s market behaviour. Jeff Anderson, head of U.S. operations at market maker STS Digital, said greater participation could reduce realized volatility, leading to shallower drawdowns as well as less dramatic highs.
Bitcoin’s volatility has declined since U.S. spot ETFs launched in early 2024. Sun put current annualized volatility at about 40%, compared with long-term historical levels above 80%. In the options market, Ardern said bitcoin’s annualized implied-volatility index, DVOL, has remained around 35 points.
Ardern characterized the likely market pattern as a series of advances, sudden gaps lower and quick recoveries rather than a smooth, accelerating curve. However, lower volatility does not eliminate the possibility of sharp price moves. Bitcoin’s supply is capped at 21 million, and a large proportion is held by long-term investors. Sun said concentrated demand from ETFs, an improvement in macroeconomic liquidity or short covering could therefore produce powerful upward moves even in a calmer market.
Warnings remain over the next downturn
Analysts quoted in the report cautioned against treating the shallow decline as proof that future losses will also be limited. Ardern said implied volatility is near a historically low percentile, while the one-year options skew remains neutral to bearish. Options skew compares the pricing of bullish call options with bearish put options; a neutral reading suggests traders are not aggressively paying for upside exposure.
He argued that protection against a fall can be cheapest when confidence in a shallow correction is strongest. In his view, the next major move could depend more on the long-dated U.S. Treasury market than on bitcoin’s recent chart pattern. The 30-year Treasury yield recently reached 5.7%, a level last seen in April 2002, and has risen by more than 80 basis points this year. Higher yields increase the opportunity cost of holding assets such as bitcoin and gold, which do not pay interest.
The Treasury announced an expanded bond-buyback program in August as yields climbed. Bitcoin subsequently rose from roughly $64,000 to almost $80,000 within days, although Treasury yields continued to rise afterward. Ardern compared the current market structure with the Nasdaq between 1994 and 1999, when policy tightened and the cycle extended while interim corrections remained relatively shallow. He also pointed to the subsequent outcome: the Nasdaq peaked in March 2000 and then lost nearly 78% over approximately two years.
Moneyiar market picture
Moneyiar market data recorded at 10:09 a.m. on Oct. 7, 2026, put Bitcoin at $83,687.40, down 2.69% over 24 hours and almost unchanged over seven days, with a seven-day decline of 0.02%.
Among the other assets tracked in the same data:
- JUST was priced at $0.13998, up 1.25% in 24 hours and 9.02% over seven days.
- Meteora stood at $0.31202, down 0.21% in 24 hours and 3.58% over seven days.
- Allora was at $0.25031, down 4.69% in 24 hours and 13.04% over seven days.
These figures are Moneyiar data and represent the market snapshot at the stated time.