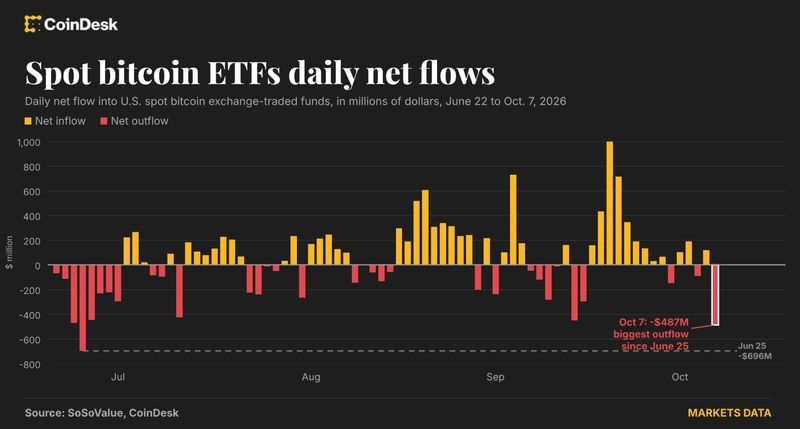
Bitcoin exchange-traded funds in the United States recorded their largest net outflow since June, highlighting a sharp reversal in investor flows as bitcoin trades near the lower end of its recent range.
ETF investors pull back
U.S. spot bitcoin ETFs saw $487.1 million in net withdrawals on Wednesday, according to CoinDesk, citing data from SoSoValue. It was the biggest single-day outflow since June 25 and came only a day after analysts said substantial ETF inflows would be needed to push bitcoin decisively above $87,000.
The move marks a notable change from the strong demand seen during the previous month. The funds attracted approximately $2.65 billion in net inflows during September. October, however, has so far recorded a cumulative net outflow of $165.6 million, with the last six trading sessions alternating between relatively small inflows and outflows.
CoinDesk’s analysis described Wednesday’s withdrawal as unusually large compared with recent activity. The outflow was about 2.1 standard deviations below the average daily flow over the previous 90 days. That average was roughly $92 million in net inflows. In statistical terms, a move of this size is uncommon: under a normal distribution, about 95% of observations fall within two standard deviations of the average.
The annual picture is also less robust than the cumulative figures since the funds launched might suggest. U.S. spot bitcoin ETFs have taken in a net $717 million so far this year, leaving only a modest positive balance after cumulative net flows reached a $5.76 billion outflow in July. Since the funds began trading in January 2024, their combined net inflow stands at $57.33 billion.
Bitcoin approaches an important price area
Bitcoin was trading near $83,000 in the source report, close to the lower boundary of the range that has held since its rally stalled on Sept. 21. Analysts have warned that a sustained move below this floor could expose the $80,000 level and disrupt the upward, step-by-step pattern visible on the daily chart.
Alex Kuptsikevich, chief market analyst at FxPro, identified the $80,500-$81,500 area as a key zone. It includes the previous month’s local highs and the 50-day moving average, a commonly watched measure of a market’s medium-term price trend.
Kuptsikevich said bitcoin could either attract buyers looking for lower prices or force investors holding leveraged positions to close them if the area fails to hold. In the first scenario, he said, the market could quickly retest recent highs. In the second, he pointed to possible declines toward $76,000, described as recent lows, or $72,000, identified as the 200-day moving average.
The ETF flows matter because these funds have been an important source of buying during bitcoin’s August-September advance. A sustained reduction in that demand would remove part of the support that helped the earlier rally, particularly while the cryptocurrency is already testing the bottom of its recent consolidation pattern.
Wider market pressures remain in focus
Bitcoin is also facing pressure from broader financial and geopolitical developments. Volatility in U.S. Treasury notes is a potential headwind, while any escalation in tensions between the United States and Iran could affect oil prices and overall appetite for riskier assets.
The source material also noted that bitcoin’s chart position was near the lower end of its recent consolidation range. A break below that range would represent a bearish resolution and could bring the 50-day average into focus at $80,550.
These levels describe possible areas of market attention rather than guaranteed outcomes. The central issue for investors is whether the recent ETF withdrawals represent a short-lived fluctuation or the beginning of a more persistent weakening in demand. Wednesday’s flow alone does not answer that question, but its size makes it an important development as bitcoin approaches technical support.
Moneyiar market picture
Moneyiar data at 21:39 on Oct. 8, 2026, showed bitcoin at $81,671.14, down 1.88% over 24 hours and 3.36% over seven days.
Other listed assets showed mixed performance:
- Monad was priced at $0.0244914, down 3.72% in 24 hours and 26.89% over seven days.
- Ontology stood at $0.0600962, up 3.78% over 24 hours and 3.06% over seven days.
The latest bitcoin reading places the cryptocurrency below the roughly $83,000 level cited earlier and close to the $80,500-$81,500 zone identified by Kuptsikevich. Whether ETF demand stabilizes or remains negative is likely to remain a closely watched part of the market picture.