U.S.-listed spot bitcoin exchange-traded funds have attracted more than $1 billion this week, offering evidence that institutional interest in bitcoin may be returning. But the pace of buying remains below the levels associated with the cryptocurrency’s strongest advances since the funds launched.
According to CoinDesk, data from SoSoValue shows that the ETFs received about $1.08 billion over three days. The inflows have encouraged market participants looking for signs of renewed institutional demand, although analysts caution that a few strong sessions do not yet establish a durable trend.
“Institutional demand shows tentative improvement. However, flows remain volatile and sustained inflows are needed to confirm a stronger recovery,” Vikram Subburaj, chief executive of India-based Giottus, said in an email.
How ETF flows compare with past rallies
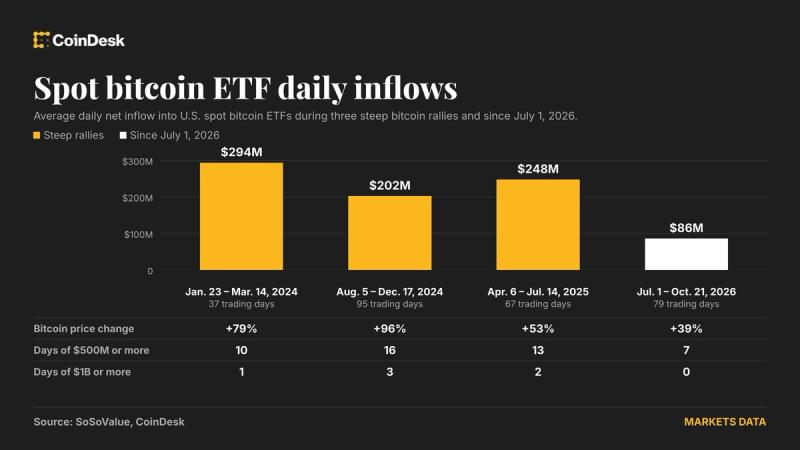
The comparison with bitcoin’s previous major advances is central to the current debate. Since U.S.-listed spot bitcoin ETFs began trading in January 2024, the cryptocurrency has experienced three steep rallies. In each case, bitcoin rose by more than 50% without falling more than 20% from its highest level during the rally.
The first advance lasted from Jan. 23 to March 14, 2024. Bitcoin climbed 79%, from roughly $39,900 to $71,400, while the funds recorded average daily net inflows of $294 million. There were 10 days when inflows reached at least $500 million, including one day above $1 billion.
The second rally ran from Aug. 5 to Dec. 17, 2024. Bitcoin gained 96%, rising from about $54,100 to $106,100. Average daily ETF inflows were $202 million, with 16 sessions above $500 million and three above $1 billion.
The third period, from April 6 to July 14, 2025, produced a 53% increase, taking bitcoin from approximately $78,400 to $119,900. ETF inflows averaged $248 million per day. There were 13 days above $500 million and two days above $1 billion.
Taken together, those three rallies covered 199 trading days. The ETFs collected $46.7 billion during that period, equivalent to average daily inflows of about $235 million. Inflows reached at least $500 million on 39 days and exceeded $1 billion on six occasions.
Current demand is stronger, but still inconsistent
The more recent flow pattern has been less forceful. Since July 1, bitcoin has risen 39%, from around $60,000 to $83,500, while the ETFs have averaged approximately $86 million in daily inflows. That is well below the $200 million-plus daily average seen during the three earlier steep rallies.
The frequency of large inflow sessions also differs. Since July 1, there have been seven days with inflows of at least $500 million—roughly one in every 11 trading days. During the three previous rallies, a session of that size occurred about once in every five trading days. The current period has also recorded no single day with inflows of $1 billion or more.
The figures do not establish that ETFs are the only factor behind bitcoin’s price movements. Investors can gain exposure through futures markets or by purchasing bitcoin directly in the spot market. Those channels may also contribute to upward price pressure, meaning ETF data alone cannot capture all demand for the cryptocurrency.
Still, the historical comparison gives investors a framework for interpreting the latest inflows. The recent $1 billion-plus total indicates renewed buying, but a sustained and stronger stream of capital would more closely resemble the conditions that accompanied bitcoin’s previous sharp advances. Past market behavior is a reference point rather than a guarantee of what happens next.
Moneyiar market picture
Moneyiar market data at 23:04 on Oct. 22, 2026, showed bitcoin at $81,260.48, down 3.68% over 24 hours and 1.19% over seven days. The price is below the approximately $83,500 level cited for the move since July 1 in the ETF analysis.
Other listed cryptoassets were also lower over the same period:
- OriginTrail (TRAC): $0.37925, down 5.96% in 24 hours and 12.29% over seven days.
- ORDI: $3.71771, down 5.84% in 24 hours and 5.76% over seven days.
- Data Network (DATA): $0.14965, down 4.93% in 24 hours and 21.45% over seven days.
The market figures represent prices and percentage changes recorded by Moneyiar at the stated time, while the ETF flow figures come from the data cited in the report.