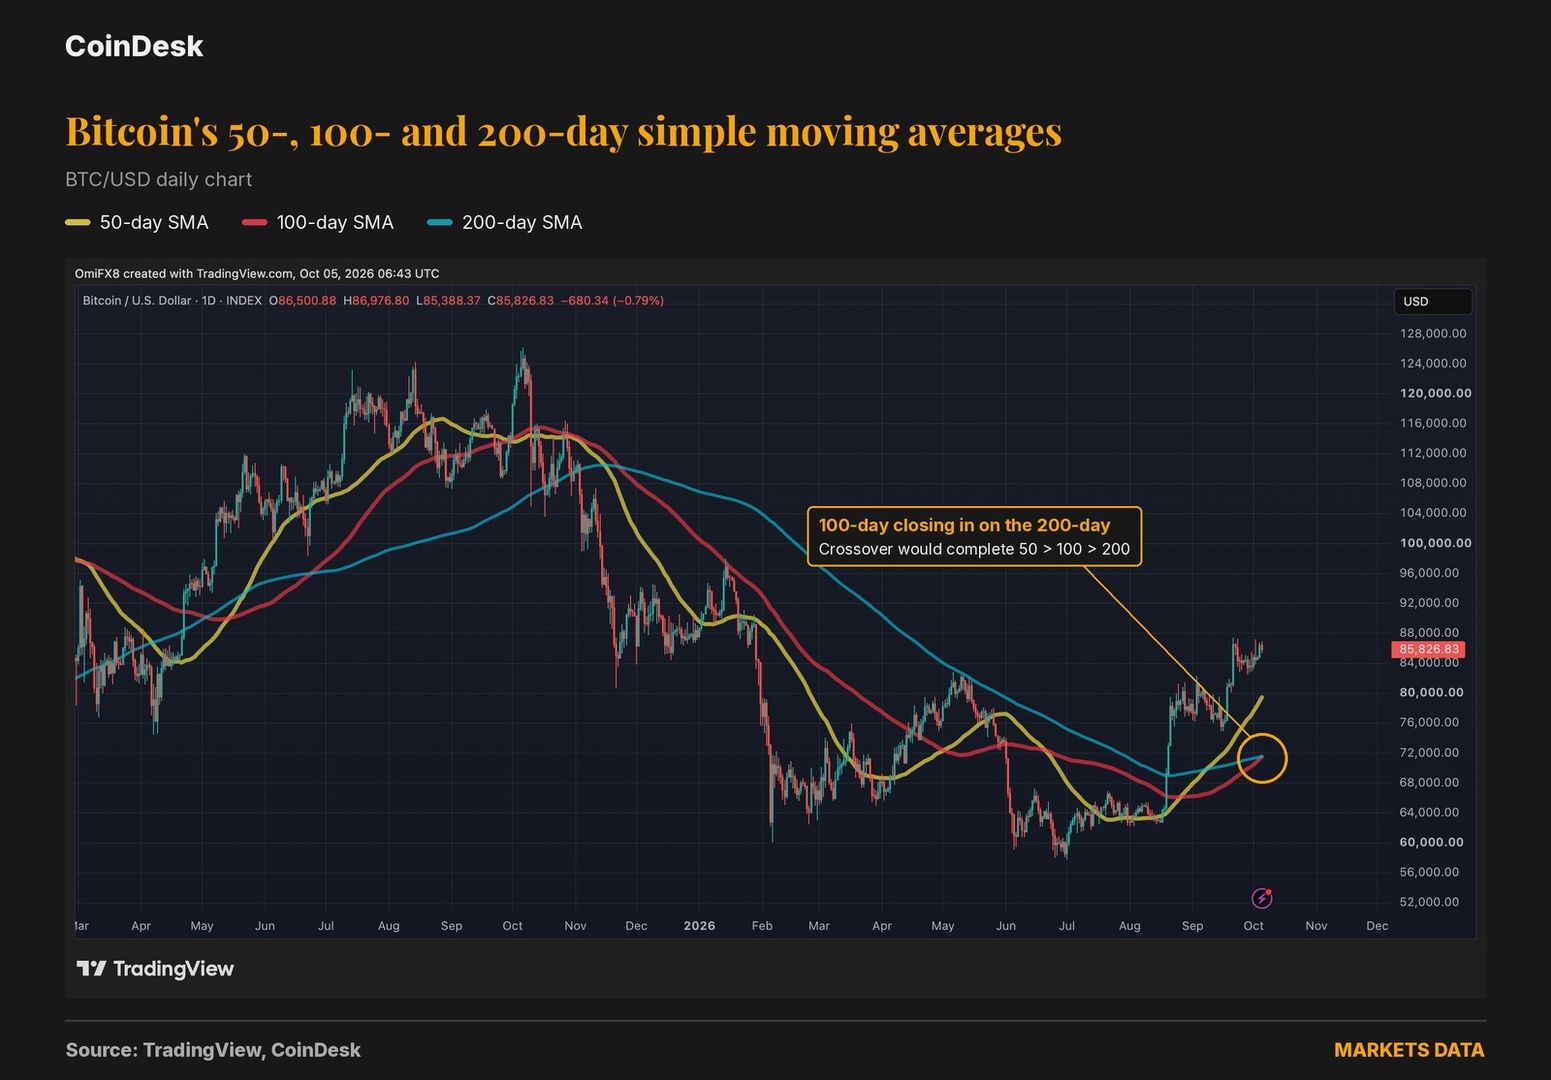
Bitcoin is approaching a technical milestone that could provide a bullish signal for the first time in more than a year, as its 50-, 100- and 200-day simple moving averages move close to the configuration traders associate with strengthening momentum.
The potential crossover comes after a sharp recovery in the cryptocurrency’s price. Bitcoin gained more than 40% to reach about $87,000 in the third quarter, although its advance has recently slowed near $85,000 as the U.S. Dollar Index has continued to rise. According to CoinDesk, the market’s next important test may be whether bitcoin can remain above its shorter-term 50-day average during any correction.
The technical signal taking shape
A fully bullish moving-average structure occurs when the 50-day average is above the 100-day average, while the 100-day average is above the 200-day average. These averages are commonly used to compare recent price action with progressively longer periods.
Bitcoin’s 50-day average was approximately $79,495 at the time of the report, already above the other two averages. The 100-day average stood near $79,493 and was rising toward the 200-day average at about $79,539. If the 100-day average moves above the 200-day average, the three averages will be ordered from shortest to longest in a way that reflects upward momentum across all three time horizons.
Vikram Subburaj, chief executive of India-based Giottus exchange, told CoinDesk that this would restore the order of the 50-day average above the 100-day average above the 200-day average for the first time since the previous alignment formed on June 24, 2025.
Moving averages do not measure the value of an asset directly. Instead, they smooth daily price movements to help traders assess the direction of a trend. When a shorter-term average rises above longer-term averages, it indicates that more recent prices have been stronger than prices from earlier periods. The approaching configuration therefore supports the view that bitcoin’s recovery over the past three months has persisted.
A signal with a mixed history
Past examples show why the crossover is closely watched, but also why it should not be treated as a guarantee of further gains. An alignment formed on Oct. 27, 2020, when bitcoin traded at roughly $13,600, and remained in place until May 2021. During that period, bitcoin reached a then-record high above $64,000.
Another alignment confirmed in early November 2023 lasted until May 2024. Bitcoin more than doubled during that period, rising from approximately $35,000 to $73,000.
The outcome has not always been as strong. A bullish alignment that developed in June 2025 lasted 97 days, while bitcoin rose only modestly from about $106,000 to $112,000. A similar setup in June 2024 lasted just 20 days, and bitcoin declined by around 10%.
Those examples underline the distinction between a technical signal and a confirmed long-term trend. Subburaj said the crossover would strengthen the case that the trend is positive, but would not ensure that the move continues. In his view, bitcoin’s subsequent price behavior will determine whether the pattern develops into a sustained bull-market structure or proves to be temporary.
The next test for bitcoin
The immediate issue is whether bitcoin can hold above its 50-day average if prices pull back. That average is currently well below the spot price, but the gap could narrow if the recent advance loses momentum. Subburaj described the ability to maintain the 50-day average during a correction as the more consequential test.
Bitcoin’s move higher has already cooled after its third-quarter advance. The cryptocurrency climbed above $87,000 before stalling around $85,000, while a sustained uptrend in the U.S. dollar has provided a tougher backdrop for the latest advance. The pending moving-average crossover would therefore arrive as the market weighs both the durability of the recovery and resistance to a stronger dollar.
Moneyiar market picture
Moneyiar data at 09:29 on Oct. 5, 2026, showed Bitcoin at $85,873.77, up 0.74% over 24 hours and 3.73% over seven days. Verge was priced at $0.003149, down 3.04% over 24 hours and 1.51% over seven days.
The moving averages discussed in the technical analysis describe historical price behavior rather than a forecast. Whether the pending alignment appears, how long it lasts and how bitcoin trades afterward remain dependent on the market’s subsequent price action.