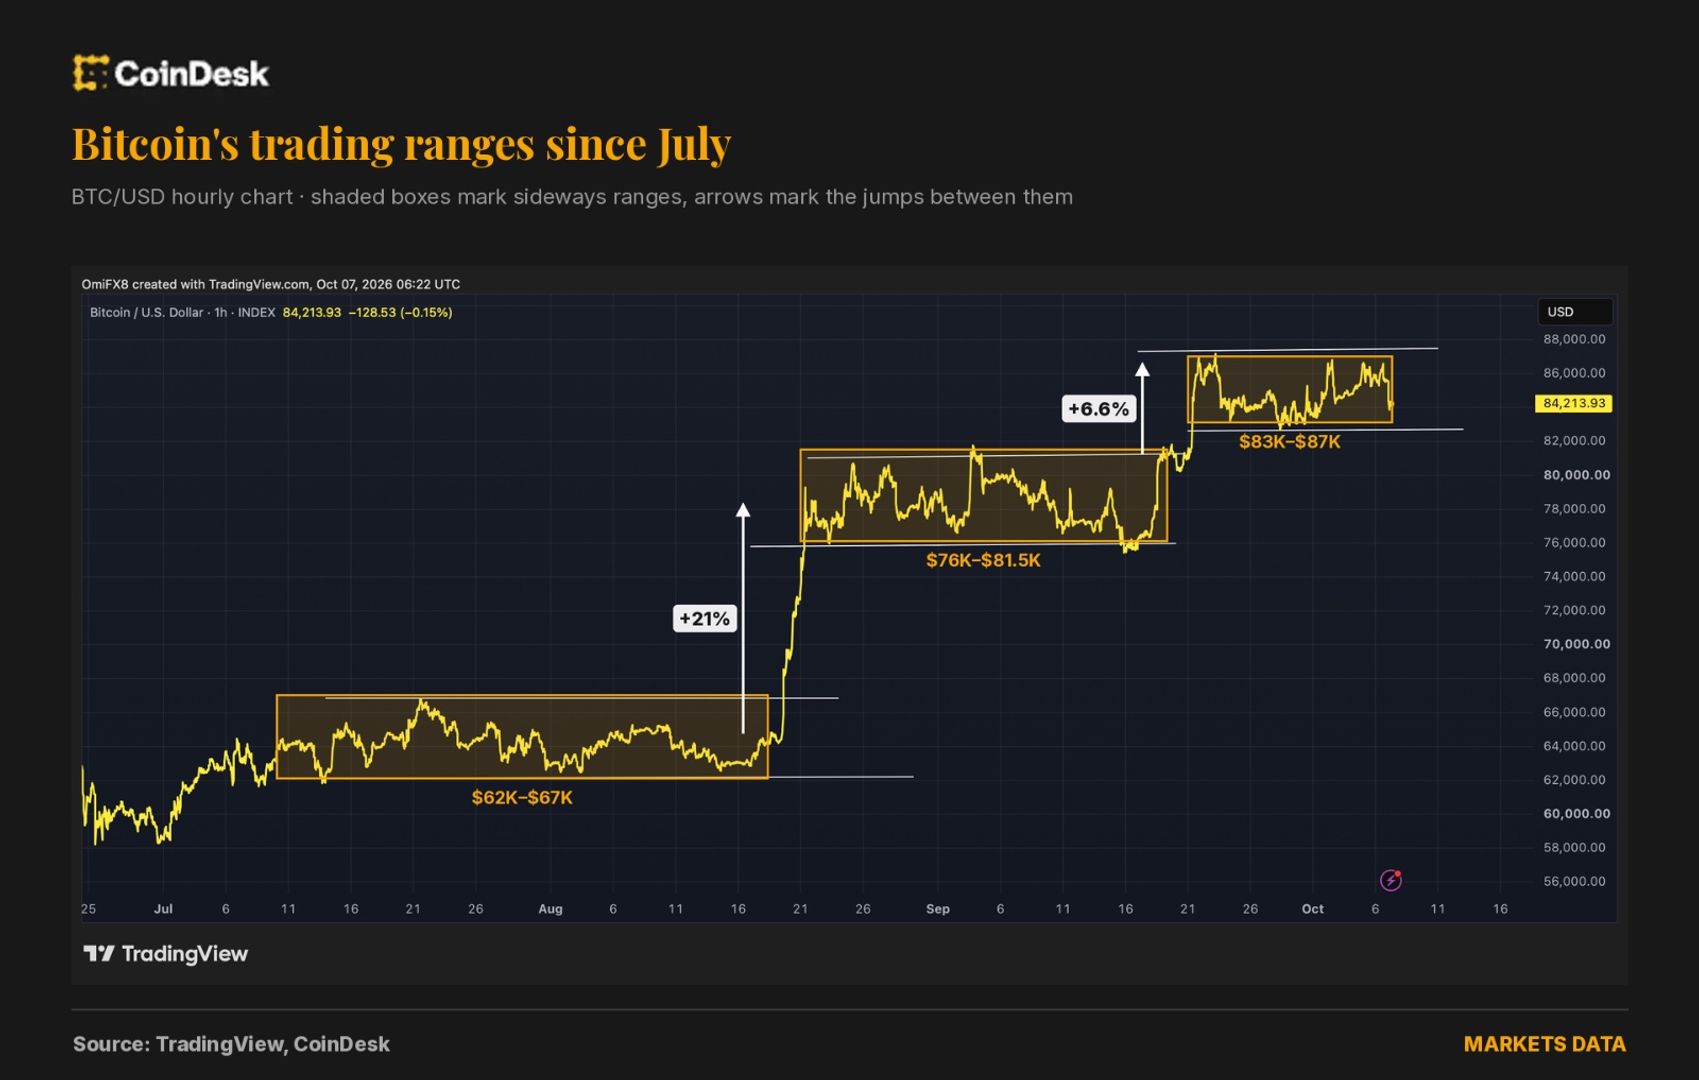
Bitcoin retreated to about $84,200 on Wednesday, but the decline has not yet broken the trading structure that has supported its broader advance since July. The cryptocurrency remains within a range established after its latest upward move, leaving the market focused on whether support around $83,000 can hold.
According to CoinDesk, bitcoin fell more than 2% from close to $86,500 on Tuesday to approximately $84,200 early Wednesday. The move put the cryptocurrency under short-term pressure, but it remained inside the roughly $83,000-to-$87,000 band in which it has traded for the past two weeks.
That range is important because it represents the latest “step” in a pattern of advances followed by periods of sideways movement. The pattern remains bullish as long as each consolidation range forms at a higher level than the one before it.
How Bitcoin’s stair-step pattern developed
Bitcoin’s move since July has consisted of several distinct trading stages. From the middle of July through Aug. 18, it traded broadly between $62,000 and $67,000. It then rose 21% over three days, creating a higher level from which the next period of consolidation began.
The following range lasted from late August into mid-September, with bitcoin trading between approximately $76,000 and $81,500. A further advance followed, as the cryptocurrency gained 6.6% between Sept. 19 and Sept. 21.
Since that move, bitcoin has generally remained between $83,000 and $87,000. On a price chart, the sharp rallies resemble upward climbs, while the subsequent flat ranges form the horizontal sections of a staircase. A retreat within the current range therefore does not, by itself, mean that the larger pattern has ended.
Vikram Subburaj, chief executive of Indian crypto exchange Giottus, told CoinDesk that the Oct. 7 decline did not invalidate bitcoin’s stair-step rise. His assessment reflects the distinction between a pullback within an established range and a sustained move below the level that supports it.
Why the $83,000 area matters
The immediate technical focus is the support zone near $83,000. Support is a price area where buying interest has previously helped limit declines. In this case, holding that level would suggest sellers have not been able to force bitcoin back into the earlier $76,000-to-$81,500 range.
Subburaj said a sustained break below approximately $82,000 to $83,000 would indicate that the September breakout had failed. Such a move would also bring the previous range back into focus, with bitcoin potentially retreating toward $80,000 to $81,500.
Alex Kuptsikevich, chief market analyst at FxPro, identified a somewhat higher level, around $84,000, as important support. He said a break below that area could open the way toward $80,000.
The different support estimates point to a relatively narrow area that traders are watching rather than a single universally accepted threshold. The central question is whether the decline remains contained within the current range or develops into a more sustained move lower.
A continued hold above the lower end of the $83,000-to-$87,000 band would preserve the evidence of higher trading ranges seen since July. Conversely, a clear and lasting move below the $82,000-to-$83,000 area would weaken that structure and suggest the latest advance has not held.
Moneyiar market picture
Moneyiar market data at 09:59 on Oct. 7, 2026, showed Bitcoin at $83,730.9848201, down 2.62% over 24 hours but up 0.16% over seven days.
Other assets in the same Moneyiar snapshot were also weaker over the 24-hour period. Notcoin stood at $0.0004583418, down 7.16% in 24 hours and 7.98% over seven days. Nesa was priced at $0.136664272, down 3.09% over 24 hours and 13.89% over seven days.
TAC Protocol was listed at $0.0065984417, showing a 69.35% 24-hour gain and a 166.36% increase over seven days; that TAC reading was timestamped Aug. 27, 2026, at 09:53.
Bitcoin’s Moneyiar price was below the approximately $84,300 level cited in the market report, but it remained close to the support area that analysts identified as decisive. For now, the data and the chart structure describe a market under pressure, but not one in which the broader stair-step trajectory has been conclusively broken.