Bitcoin has held up better than the usual market narrative would suggest as the U.S. dollar strengthens, with recent data showing that the relationship between the cryptocurrency and the Dollar Index is real but limited. According to CoinDesk, the Dollar Index, or DXY, has risen about 2.6% since Sept. 9 and reached 101.69 on Tuesday, a two-month high. Over the same broad period, bitcoin’s advance has stalled, but its retreat has been relatively contained.
Why the dollar matters to bitcoin
The DXY measures the value of the U.S. dollar against a basket of major currencies, including the euro and Japanese yen. Because the dollar is the world’s reserve currency and is central to global borrowing and financial markets, movements in the index can affect a wide range of assets.
A stronger dollar can increase the repayment burden for borrowers that owe money in dollars. Those borrowers may respond by reducing exposure to assets considered riskier, including cryptocurrencies. A rising dollar can also make dollar-denominated assets less attractive to international investors when measured in their local currencies.
That framework would normally point to pressure on bitcoin. Bitcoin’s rally did lose momentum after Sept. 21, when it reached almost $87,500, and its price later moved back toward the $83,000-to-$84,000 range. The firmer dollar may have limited bitcoin’s upside, but the move has not produced a dramatic decline based on the figures in the analysis.
Correlation shows a limited connection
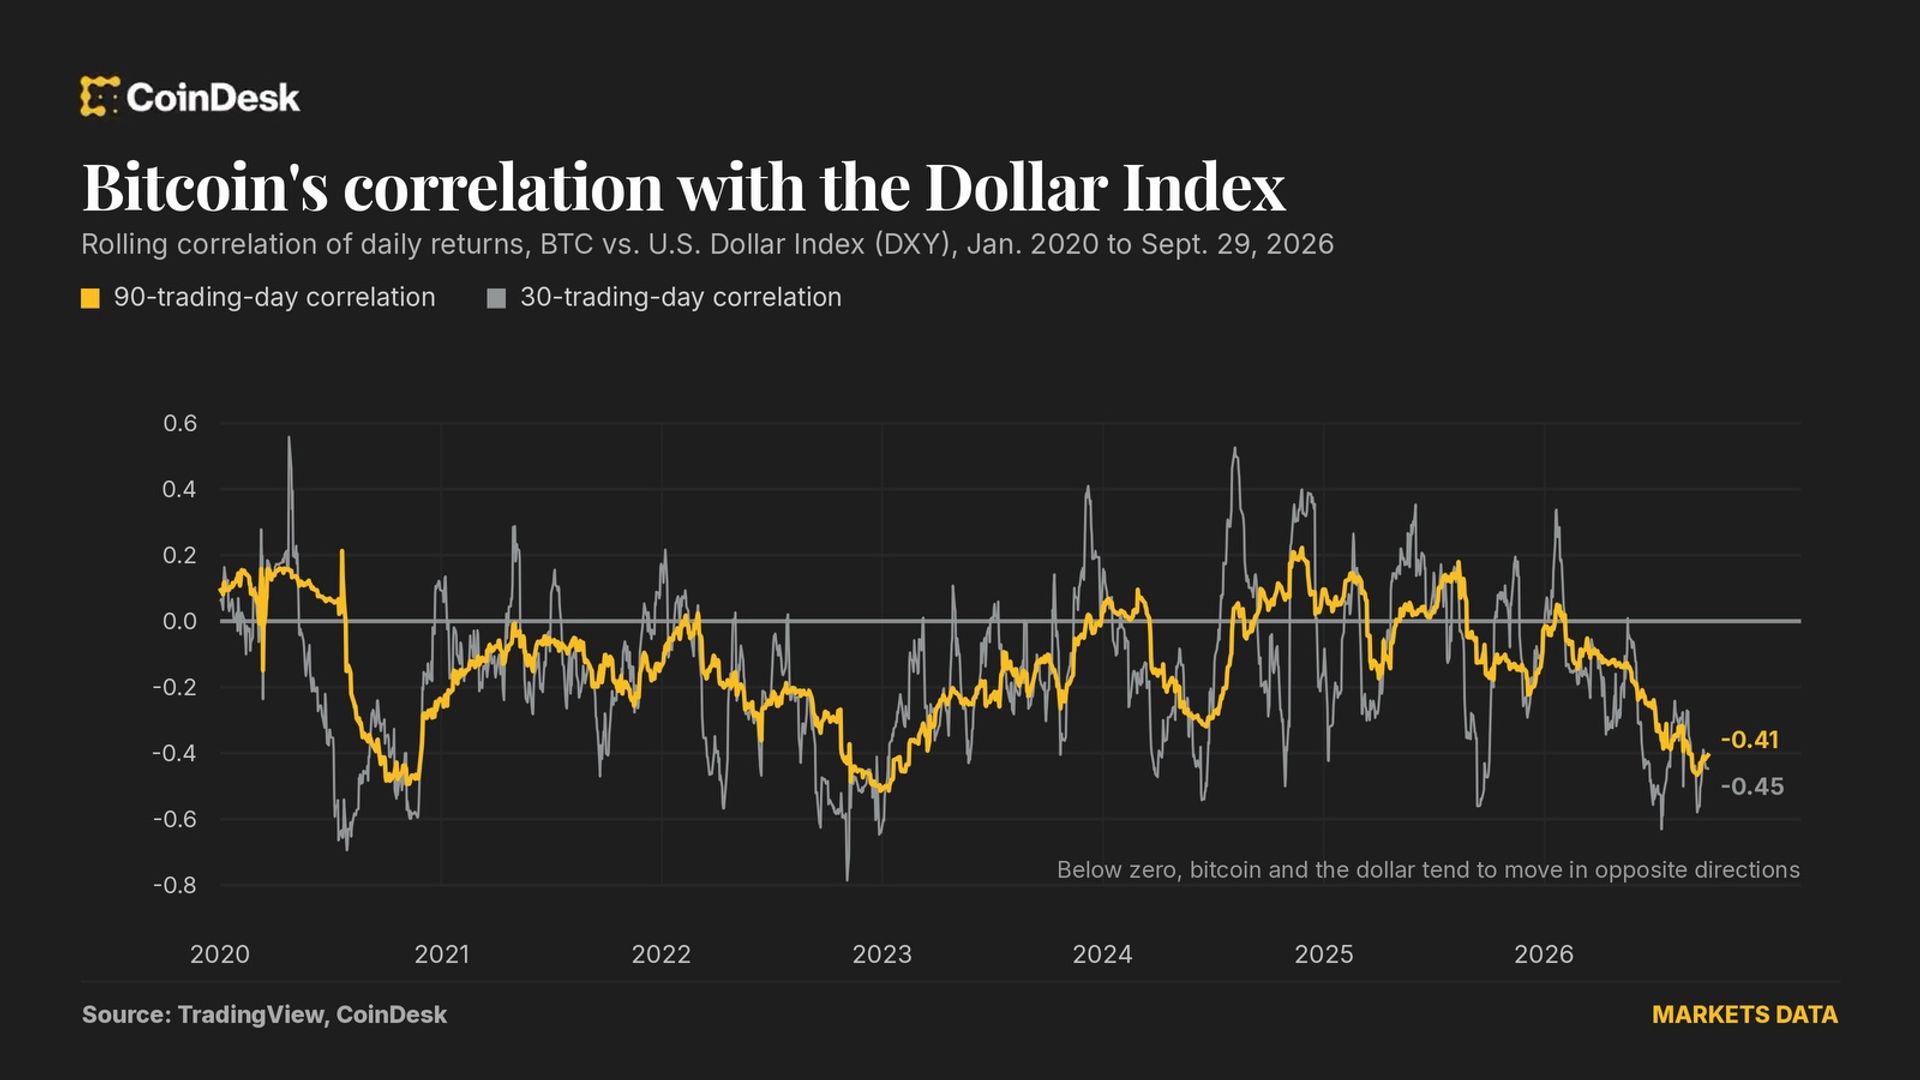
CoinDesk analyzed TradingView data covering the past 90 trading days and found a correlation of minus 0.41 between daily bitcoin and DXY moves. A negative correlation means the two assets have generally tended to move in opposite directions. The reading is the most negative since February 2023.
However, correlation does not show that one asset directly causes the other to move. The size of the relationship also matters. The minus-0.41 reading corresponds to an R-squared of 0.17, meaning changes in the DXY explain only about 17% of the variation in bitcoin’s daily returns over that period. Most of the day-to-day movement therefore reflects other influences.
The shorter-term figures are even less conclusive. The 30-day correlation stood at minus 0.45, but that result was heavily affected by two sessions—Aug. 19 and Sept. 3—when bitcoin gained more than 5% as the dollar index fell. Excluding those two days, the 30-day correlation falls to minus 0.19.
Looking back to January 2020 produces a still weaker picture. The average 90-day correlation over that period was minus 0.14, and the relationship has sometimes turned positive. It reached plus 0.22 in November 2024, showing that bitcoin and the dollar have not consistently moved in opposite directions.
What the data mean for bitcoin’s independence
The figures suggest that the dollar remains a factor for bitcoin, but not a complete explanation of its performance. Bitcoin’s links with U.S. Treasury yields have also been limited, according to CoinDesk’s recent discussion, adding to the view that the cryptocurrency can respond to drivers that are distinct from traditional macroeconomic indicators.
That characteristic is relevant to investors and portfolio analysts who view bitcoin as a potential diversifier—an asset whose price may not always move in line with other major markets. The current data do not guarantee that relationship will continue. Correlations can change as market conditions and trading behavior change.
The immediate technical picture for the dollar also remains important. DXY is trading above the Ichimoku cloud, a momentum indicator, which points to stronger bullish momentum. It has not yet broken through resistance at 101.80, the high reached on June 24. A move above that level would represent a bullish break from the choppy sideways trading pattern that has persisted since May 2025, according to the source analysis.
Moneyiar market picture
Moneyiar market data at 09:03-09:04 on Oct. 1, 2026, show bitcoin at $83,521.75, up 0.48% over 24 hours and down 0.02% over seven days. The broader set of tracked assets was mixed:
- TRON stood at $0.337287, down 0.25% in 24 hours and 0.91% over seven days.
- AKEDO traded at $0.032672, down 5.91% in 24 hours and 31.16% over seven days.
- Ronin was priced at $0.064732, up 0.37% in 24 hours and 11.84% over seven days.
These market readings are separate from the DXY analysis and reflect Moneyiar’s data at the stated time. Together with the recent bitcoin price range, they show a market in which bitcoin has remained broadly steady even as the dollar has strengthened, while individual digital assets have posted sharply different results.