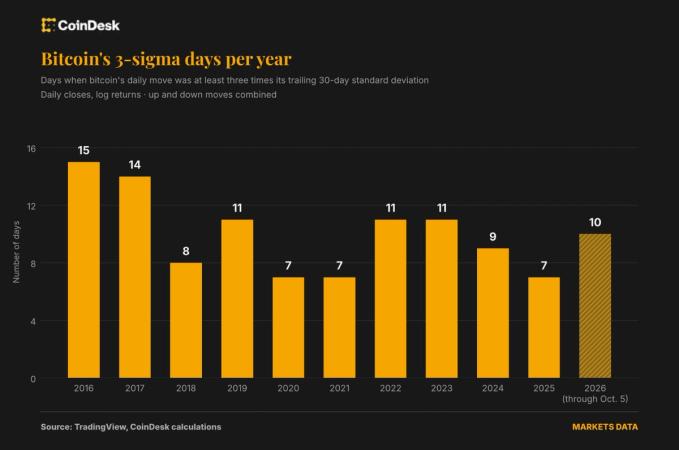
Bitcoin has become less volatile on average in 2026, but its price has produced more unusually large daily moves than during the cryptocurrency’s severe 2018 bear market. The contrast is raising questions about whether conventional portfolio risk models adequately reflect bitcoin’s potential for sudden losses.
According to CoinDesk analysis, bitcoin recorded 10 trading days in 2026 when its price moved at least three standard deviations from its recent pattern. The total is already higher than the eight such days recorded across all of 2018, a year in which bitcoin lost 73% of its value.
At the same time, annualized bitcoin volatility has declined to about 46% this year from 84% in 2018. Its average three-sigma move has also become smaller, at roughly 7% compared with about 10% eight years ago. The data point to a market with calmer typical sessions but a continuing tendency toward abrupt repricing.
What a three-sigma day means
Sigma measures how far a price movement is from an asset’s usual behavior. For its analysis, CoinDesk compared bitcoin’s daily price change with its 30-day realized volatility, which tracks how much the cryptocurrency had typically moved each day during the preceding month. A day with a move at least three times that amount, either upward or downward, was counted as a three-sigma event.
Such a move is considered unusual. In a standard bell-shaped distribution, around 95% of observations fall within two standard deviations and about 99.7% fall within three. A high number of three-sigma days therefore indicates that large shocks remain a feature of the market, even when shorter-term volatility measures are declining.
The pattern also distinguishes bitcoin from several other volatile assets. Since 2024, bitcoin’s volatility has been approximately 47%, similar to Nvidia’s. However, bitcoin recorded 26 three-sigma days during that period, compared with eight for Nvidia. The S&P 500 recorded 16 and gold 12.
Nicolas Quatravaux, head of EMEA at institutional crypto-derivatives liquidity network Paradigm, said the market now benefits from greater institutional participation, exchange-traded funds and deeper liquidity. Those factors have helped make average trading conditions calmer, he said, but have not eliminated shocks linked to macroeconomic developments, leverage and market positioning.
Why lower volatility can distort risk estimates
The figures matter for investors and portfolio managers who use recent price behavior to determine how much bitcoin exposure a portfolio can tolerate. One common measure is value-at-risk, or VaR, which estimates a loss threshold for a portfolio over a specified period.
Because some VaR models rely heavily on recent volatility, a prolonged quiet period can make an asset appear safer. Bitcoin’s declining 30-, 90- and 180-day volatility readings could consequently encourage larger allocations. But a lower recent average does not necessarily capture the possibility of a rare, severe move beyond the model’s expected threshold.
That possibility is known as tail risk. VaR indicates the boundary of an expected loss but does not show how large losses might become after that boundary is breached. Bitcoin’s repeated three-sigma sessions illustrate why a market can look calmer in everyday trading while retaining significant exposure to extreme outcomes.
Luuk Strijers, chief executive of crypto options exchange Deribit, said standard VaR measures do not fully assess tail risk. He pointed to Expected Shortfall and similar approaches, which focus on the severity of losses during the worst trading periods rather than only estimating how often a threshold may be exceeded. He also said bitcoin options can be used to hedge three-sigma risks.
Macroeconomic news and crowded derivatives trades
Market participants cited two related sources of sudden price movements: unexpected macroeconomic headlines and derivatives positions that assume prices will remain stable.
When traders sell options to collect premiums, they are effectively taking the other side of protection against large moves. The strategy can perform while prices remain within a range. A sharp market reaction to a headline can force those traders to adjust or close positions, potentially intensifying the initial move.
Alexander S. Blume, co-founder and chief executive of Two Prime, said call overwriting has become a particularly crowded trade. In this strategy, investors who already own bitcoin sell call options in exchange for income while giving up some upside. Blume said a rising market can trigger a short squeeze when those positions need to be covered, amplifying the advance.
Quatravaux described 2026 as an example of this dynamic, citing money rotation into technology stocks, DeFi hacks, positioning for volatility-selling and structured products, and subsequent macroeconomic headlines involving Donald Trump, the Iran war and the Federal Reserve. He said that when many participants are short volatility, one major headline can produce an outsized trading day.
A deeper market that still absorbs shocks
The persistence of extreme moves does not necessarily mean the market is as fragile as it was in earlier cycles. On Sept. 21, the date of bitcoin’s latest three-sigma jump identified in the report, Paradigm facilitated a record $6.7 billion in options trading.
Quatravaux said there had been no reports of a trading desk taking a damaging loss from that event. He attributed the market’s ability to absorb the shock to more sophisticated participants, improved risk management and increased institutional capital.
Those developments may have reduced the impact of a difficult period compared with earlier years, but they have not removed the underlying risk. Quatravaux said extreme days are likely to remain part of bitcoin trading because macroeconomic shocks cannot be eliminated.
Current bitcoin market picture
Moneyiar market data at 11:29 on Oct. 11, 2026, showed bitcoin at $82,972.3657. The cryptocurrency was up 0.28% over 24 hours but down 2.74% over seven days. The figures provide a current price snapshot and do not change the longer-term volatility findings in the analysis.