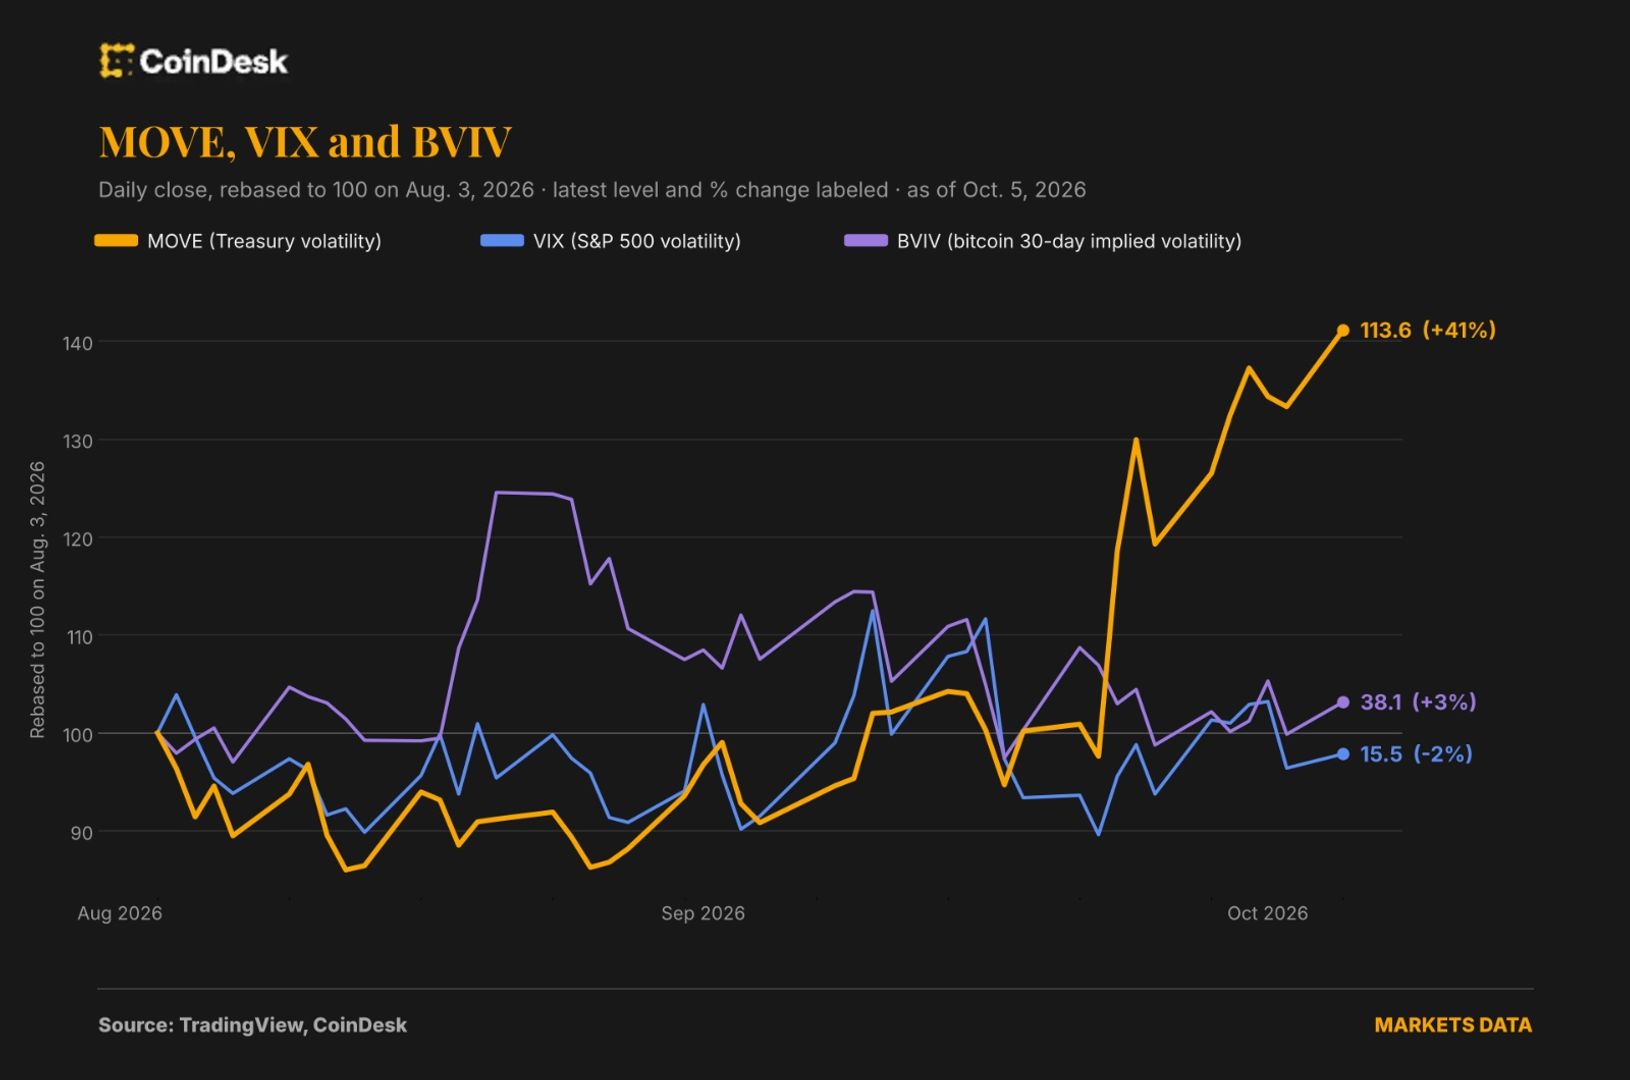
The bond market is sending a more unsettled signal than bitcoin and U.S. stocks, with the MOVE Index approaching a high reached in March while equity and crypto volatility measures remain near their lows for the year. The divergence is drawing attention from macro observers who see Treasury-market turbulence as a potential early warning for wider financial stress.
MOVE index points to rising Treasury uncertainty
The MOVE Index, formally the ICE BofA U.S. Bond Market Option Volatility Estimate, measures how sharply traders expect U.S. Treasury yields to move over the coming month. It uses options tied to two-, five-, 10- and 30-year Treasury securities, giving the 10-year note the greatest weight. Unlike a yield forecast, the index indicates the expected size of market moves rather than their direction.
The index rose 46% in June and is now around 116, close to its March peak and at its highest level since April 2025. The next notable level is 140, which was reached in early April when rising U.S.-China trade tensions unsettled global markets.
Kurt S. Altrichter, a wealth manager and author of the RiskSIGNAL Report, said the MOVE Index was forming higher lows while the VIX, which measures expected volatility in the U.S. stock market, was making lower highs. He argued that the bond measure had preceded the VIX during periods of turbulence in 2022, 2023 and at the beginning of the Iran war. His broader point was that stocks can be slow to reflect stress that first appears in government bonds, according to CoinDesk.
Treasury securities have an important role in global finance as widely used collateral and as a reference point for borrowing costs. Consequently, larger expected moves in Treasury yields can contribute to tighter financial conditions, higher risk premiums and a broader reduction in appetite for risky assets. That makes the MOVE Index a closely watched indicator beyond the government-bond market itself.
Corporate borrowing volatility is also climbing
The increase in Treasury volatility is occurring alongside a sharp rise in volatility measures for corporate bonds. Cboe said on X that volatility for both investment-grade and high-yield corporate debt had moved from low levels two weeks earlier to much higher percentile readings.
Investment-grade bond volatility rose from the sixth percentile to the 79th percentile, while high-yield volatility climbed from the 11th percentile to the 84th percentile. These figures describe where current volatility sits compared with its historical range, rather than indicating a direct change in borrowing rates or predicting a particular market outcome.
The development matters because corporate debt markets are sensitive to both the cost of financing and investors’ willingness to accept credit risk. A jump in volatility does not by itself establish that credit conditions will deteriorate, but it shows that markets are pricing greater uncertainty around corporate bonds.
Bitcoin and equities have not reflected the signal yet
Bitcoin and U.S. stocks have so far appeared calmer than the Treasury market. CoinDesk’s analysis found that bitcoin’s daily returns did not closely track the MOVE Index over 60- or 90-day periods. However, analysts previously told CoinDesk that abrupt increases in Treasury volatility can weigh on bitcoin, with the scale of the bond-market move potentially more important than whether yields rise or fall.
For now, bitcoin’s 30-day implied-volatility measure, known as BVIV, and the S&P 500’s VIX are both near their lows for the year. The contrast leaves traders watching whether volatility in those markets begins to rise if the MOVE Index moves decisively above its March high.
The outlook is not one-sided. The source material cited steady inflows into exchange-traded funds, fewer deposits by large bitcoin holders into exchanges and supportive regulatory developments as factors underpinning the bullish case for digital assets. Those supports exist alongside the warning from the bond market, creating a split picture rather than a confirmed change in trend.
Current market picture
Moneyiar data recorded on Oct. 7, 2026, at 10:04 a.m. Tehran time put bitcoin at $83,706.54. The cryptocurrency was down 2.66% over the previous 24 hours and was almost unchanged over seven days, with a decline of 0.04%.
That market snapshot is separate from the volatility readings described above, but it shows bitcoin trading below the $84,000 level mentioned in the source material’s market updates. The key issue for observers is whether rising volatility in Treasuries remains contained or is followed by broader moves in bonds, equities and cryptocurrencies.