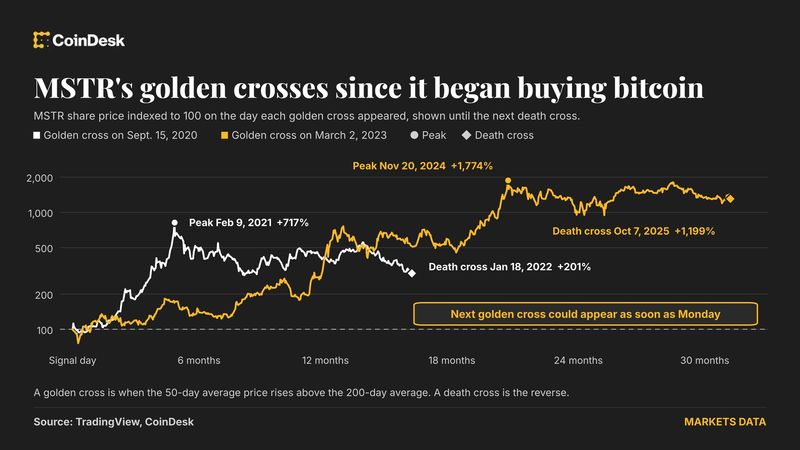
Strategy’s stock is approaching a technical milestone that has previously preceded powerful rallies, but the company’s own history also shows why investors should treat the signal cautiously.
A closely watched chart signal
Strategy, the largest publicly listed holder of bitcoin, could see its 50-day moving average rise above its 200-day moving average as soon as Monday, according to CoinDesk. This pattern is known as a golden cross and is often interpreted by traders as a sign that upward momentum is strengthening over a longer period.
The company held $69.81 billion worth of bitcoin, according to the source material. Its stock, identified by the ticker MSTR, was priced at $135.98 at the market close cited by CoinDesk.
A moving average smooths daily price fluctuations over a chosen period. The 50-day average reflects more recent trading, while the 200-day average provides a longer-term view. When the shorter average moves above the longer one, some market participants regard it as confirmation of a bullish shift. The reverse pattern, when the 50-day average falls below the 200-day average, is called a death cross.
Strategy’s potential signal comes several weeks after bitcoin confirmed its own golden cross on Sept. 8. CoinDesk reported that bitcoin had gained nearly 5% since that event, reaching $82,000, after extending a recovery from July lows below $60,000. The cryptocurrency also traded above $87,000 early in October.
Strategy’s two previous golden crosses
Since Strategy began purchasing bitcoin for its balance sheet in August 2020, the stock has recorded two golden crosses. Both were followed by substantial gains, although past performance does not establish that the current signal will produce the same result.
The first occurred on Sept. 15, 2020, when MSTR traded at approximately $15.57. By February 2021, the shares had reached $127.29, representing a 717% increase. A death cross appeared in January 2022, by which point the stock stood at $46.83—still about three times its level when the earlier golden cross appeared.
The second golden cross came on March 2, 2023, with the shares at $25.29. MSTR later climbed to $473.83 in November 2024, a gain of 1,774%. When the next death cross arrived in October 2025, the stock was trading at $328.40, or 1,199% above its price at the time of the 2023 golden cross.
These episodes help explain why traders are focusing on the chart. Strategy’s business and market profile are closely connected to bitcoin because the company has accumulated the cryptocurrency as a balance-sheet asset. As a result, shifts in bitcoin’s price can be an important part of the backdrop for MSTR’s shares.
Why the indicator needs caution
The golden cross is not a consistently reliable forecasting tool. CoinDesk’s analysis of Strategy’s stock since 1999 found 19 golden crosses. The shares were higher three months after 11 of those signals and higher 12 months later after only 10.
That amounts to an accuracy rate of 50% for the 12-month outcome in the cited analysis. The median return 12 months after a golden cross was just 3.3%. The two weakest signals, in 2001 and 2007, were followed by a 61% decline.
The record suggests that a golden cross can describe an improvement in recent price momentum without guaranteeing a prolonged advance. It is a backward-looking measure based on past prices, and the signal may appear after a significant part of a move has already taken place. In Strategy’s case, the earlier crosses were followed by exceptional rallies, but the broader historical record is considerably less decisive.
The question now is whether MSTR will follow bitcoin’s recent technical lead. CoinDesk described Strategy’s chart as having also broken above a trendline, another development that may be viewed as supportive by technical traders. Whether that translates into additional gains remains uncertain.
Current bitcoin market picture
Moneyiar market data at 21:59 on Oct. 19, 2026, showed bitcoin at $81,941.48. The cryptocurrency was up 0.99% over the previous 24 hours but down 0.64% over the previous seven days.
Those figures place bitcoin close to the $82,000 level cited in CoinDesk’s report. They also show that the latest daily increase had not fully offset the modest decline recorded over the seven-day period. The data describe bitcoin’s market position at that specific time and do not indicate how Strategy’s pending moving-average signal will develop.