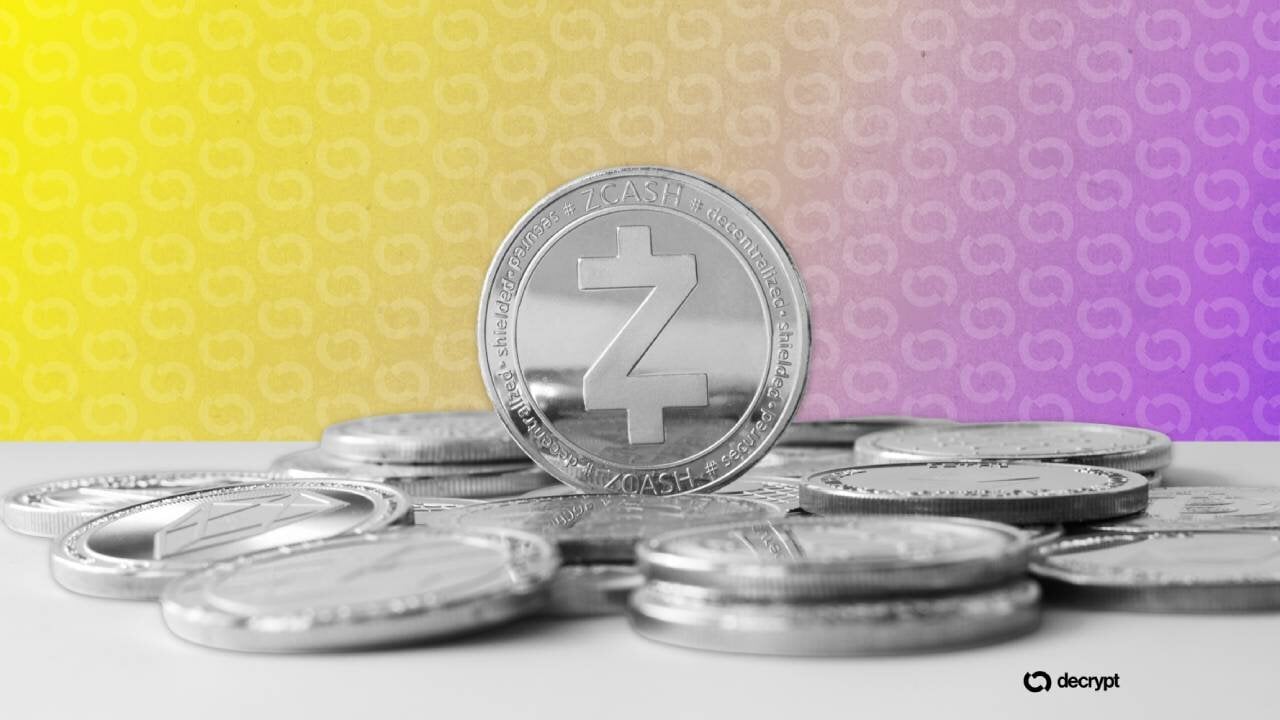
Zcash has pulled back sharply after one of the strongest rallies in the cryptocurrency market, with ZEC trading at $1,333.50 in the report, down 7.29% on the day and roughly 21% below its late-September high of $1,698.00. The decline follows a gain of about 253% from a base of $480.72.
The retreat comes as investors assess a large daily withdrawal from Grayscale’s Zcash exchange-traded fund and renewed attention on funds linked to the Bitget exchange hack. Even after the latest decline, technical indicators described in the report continue to show a strong broader trend, although short-term momentum has cooled.
According to Decrypt, the market backdrop has also been unsettled. Bitcoin briefly rose to $85,600 after softer-than-expected PCE inflation data, but soon surrendered those gains. The 10-year Treasury yield closed at 5.29%, while the probability of an October Federal Reserve rate increase fell from 70% to below 50%, according to CME FedWatch.
ETF inflows reverse course
Grayscale launched its Zcash ETF, ticker ZCSH, on Aug. 25. By mid-September, the fund had recorded $233 million in cumulative net inflows, indicating substantial demand during Zcash’s advance.
The picture changed on Sept. 30, when ZCSH registered a $30.25 million net outflow. Cumulative net inflows nevertheless remained close to $268 million after that session. The fund’s three-for-one share split also took effect that morning.
An ETF gives investors exposure to an asset through a listed fund rather than requiring them to hold the underlying cryptocurrency directly. As a result, flows into and out of the vehicle are closely watched as one measure of investor demand. A single day of outflows does not erase the fund’s overall inflow total, but it adds to the pressure surrounding a token that has recently experienced a rapid price increase.
Bitget hack adds to the sentiment problem
The separate issue involving Bitget has brought additional scrutiny to Zcash. Hackers stole approximately $387 million from the exchange on Sept. 24, an estimate that rose from an initial $351.6 million after transfers on the Zcash and Tron blockchains were included.
Bitget’s chief executive said the attack was consistent with North Korean hacker groups, although firm attribution remained pending in the source material. On Wednesday, blockchain investigator ZachXBT identified the movement of 2,746 ZEC, valued at about $3.9 million, from addresses connected to the hack into Zcash’s shielded pool.
Zcash’s shielded pool is designed to conceal transaction details, including the sender, recipient and amount. The transfer therefore carries significance for market sentiment, particularly for a privacy-focused cryptocurrency seeking to establish a stronger reputation among Wall Street investors.
The reported movement was not identified as the likely trigger for the day’s fall. The amount was also relatively small compared with the total value stolen in the Bitget attack. However, the association does little to improve sentiment while ZEC is already dealing with a substantial correction and an ETF outflow.
Technical picture: correction rather than collapse
The indicators cited in the report suggest that Zcash remains in a powerful longer-term trend, even as its recent price action points to a deeper pullback.
The Relative Strength Index, or RSI, was 50.2. The RSI ranges from 0 to 100 and is commonly used to assess buying and selling momentum. A reading near 50 is considered neutral, meaning ZEC was neither showing an overbought condition nor an oversold one after the earlier rally.
The Average Directional Index, or ADX, stood at 52.0. ADX measures trend strength rather than direction, and readings above 25 are generally viewed as evidence of a meaningful trend. The elevated reading reflects the intensity of Zcash’s recent advance, but because the indicator lags price, it can remain high even during a decline.
The 50-day exponential moving average was still above the 200-day EMA. These averages give greater weight to recent prices, and the positioning of the shorter-term average above the longer-term one keeps the underlying chart structure bullish on the report’s analysis. A sustained and rapid decline could bring the two averages closer together, a development often watched for signs of a changing trend.
The report compared the current pullback with Zcash’s performance in June, when the token fell from $635 to an intraday low of $309 after disclosure of a critical vulnerability in its shielded pool. ZEC later climbed above $1,600. That history does not determine the next move, but it illustrates how a sharp decline has previously been followed by a renewed advance.
A daily close below $1,233.00 was identified as a level that could bring the “golden zone” into play, while a move back above $1,410.72 would indicate that the recent advance was regaining momentum.
Moneyiar market picture
Moneyiar market data at 09:28 on Oct. 3, 2026, showed Zcash at $1,313.895966811, down 5.35% over 24 hours and 13.62% over seven days. The updated figure is below the $1,333.50 price cited in the report, showing that the pullback continued at the later measurement time.
Other assets in the supplied Moneyiar data were mixed: Monad was $0.0313878852, down 6.22% over 24 hours but up 19.46% over seven days; ONEchain was $0.1423621153, up 3.2% over 24 hours and down 4.46% over seven days; and Flow was $0.0317863962, down 1.57% over 24 hours and 0.14% over seven days.